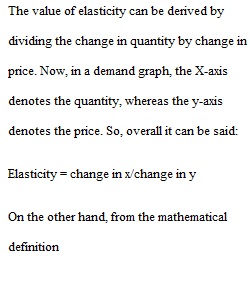


Q 1. Revisit the relationship between the slope and the concept of elasticity. 2. Use the midpoint elasticity formula and the following PiandQd data to calculate their elasticity values. Pi = $9, $7, $5, $3 and Qd=15, 25, 35, 45. 3. Show diagrammatically and algebraically cases of unitary elasticity, as discussed in class. Connect these with pertinent examples involving products and services. 4. Identify business cases/situations/products with elasticity values: a. close to zero, and b. close to infinity 5. What is the impact of “time” on elasticity values and applications? 6. What would happen to the demand for luxuries and necessities if wealth were to be redistributed from the wealthy to the poor? 7. Why does the MR bisect the OD distance on the X-axis? (Recall the diagram from my lecture). 8. What is the best case scenario between Marginal Revenue and Total Revenue? Do we want Total Revenue to be maximized and Marginal Revenue to be equal to zero or do we want Total Revenue to be rising and Marginal Revenue to be positive? 9. Also, research and discuss the concept of “conspicuous consumption” and of “Institutional Economics.” 10. OD is the distance from the point of origin between the X and Y axes and the intersection of the D-curve with the X axis. The OD distance, is the distance on the diagram from the point of origin to number 120.-The Marginal Revenue (MR) MUST ALWAYS bisect the OD distance on the X-axis! (The MR bisects that distance at the value of 60). Why does this happen? Please see Elasticity Diagram at the top of the assignment description.
View Related Questions